DATA IQ
An interactive data analytics tool
Role: Project Owner
Client: Channel and Category Development,
Unilever Thai Trading
2021

Previously, business reports were owned by different functions and were done according to each function's preference. Therefore, we ended up with disparate reports with lots of numbers which were difficult to interpret into business insight. Since all data were not in one place, many ad hoc reports were requested to cover the missing data, making it extremely time consuming and inefficient.
Background


My first approach on this project was to understand users, what kind of data they were looking for, how they made use of them, and what business questions they needed to answer from these data. Originally, many back and forth processes had to be taken for users to translate these data into business insights.
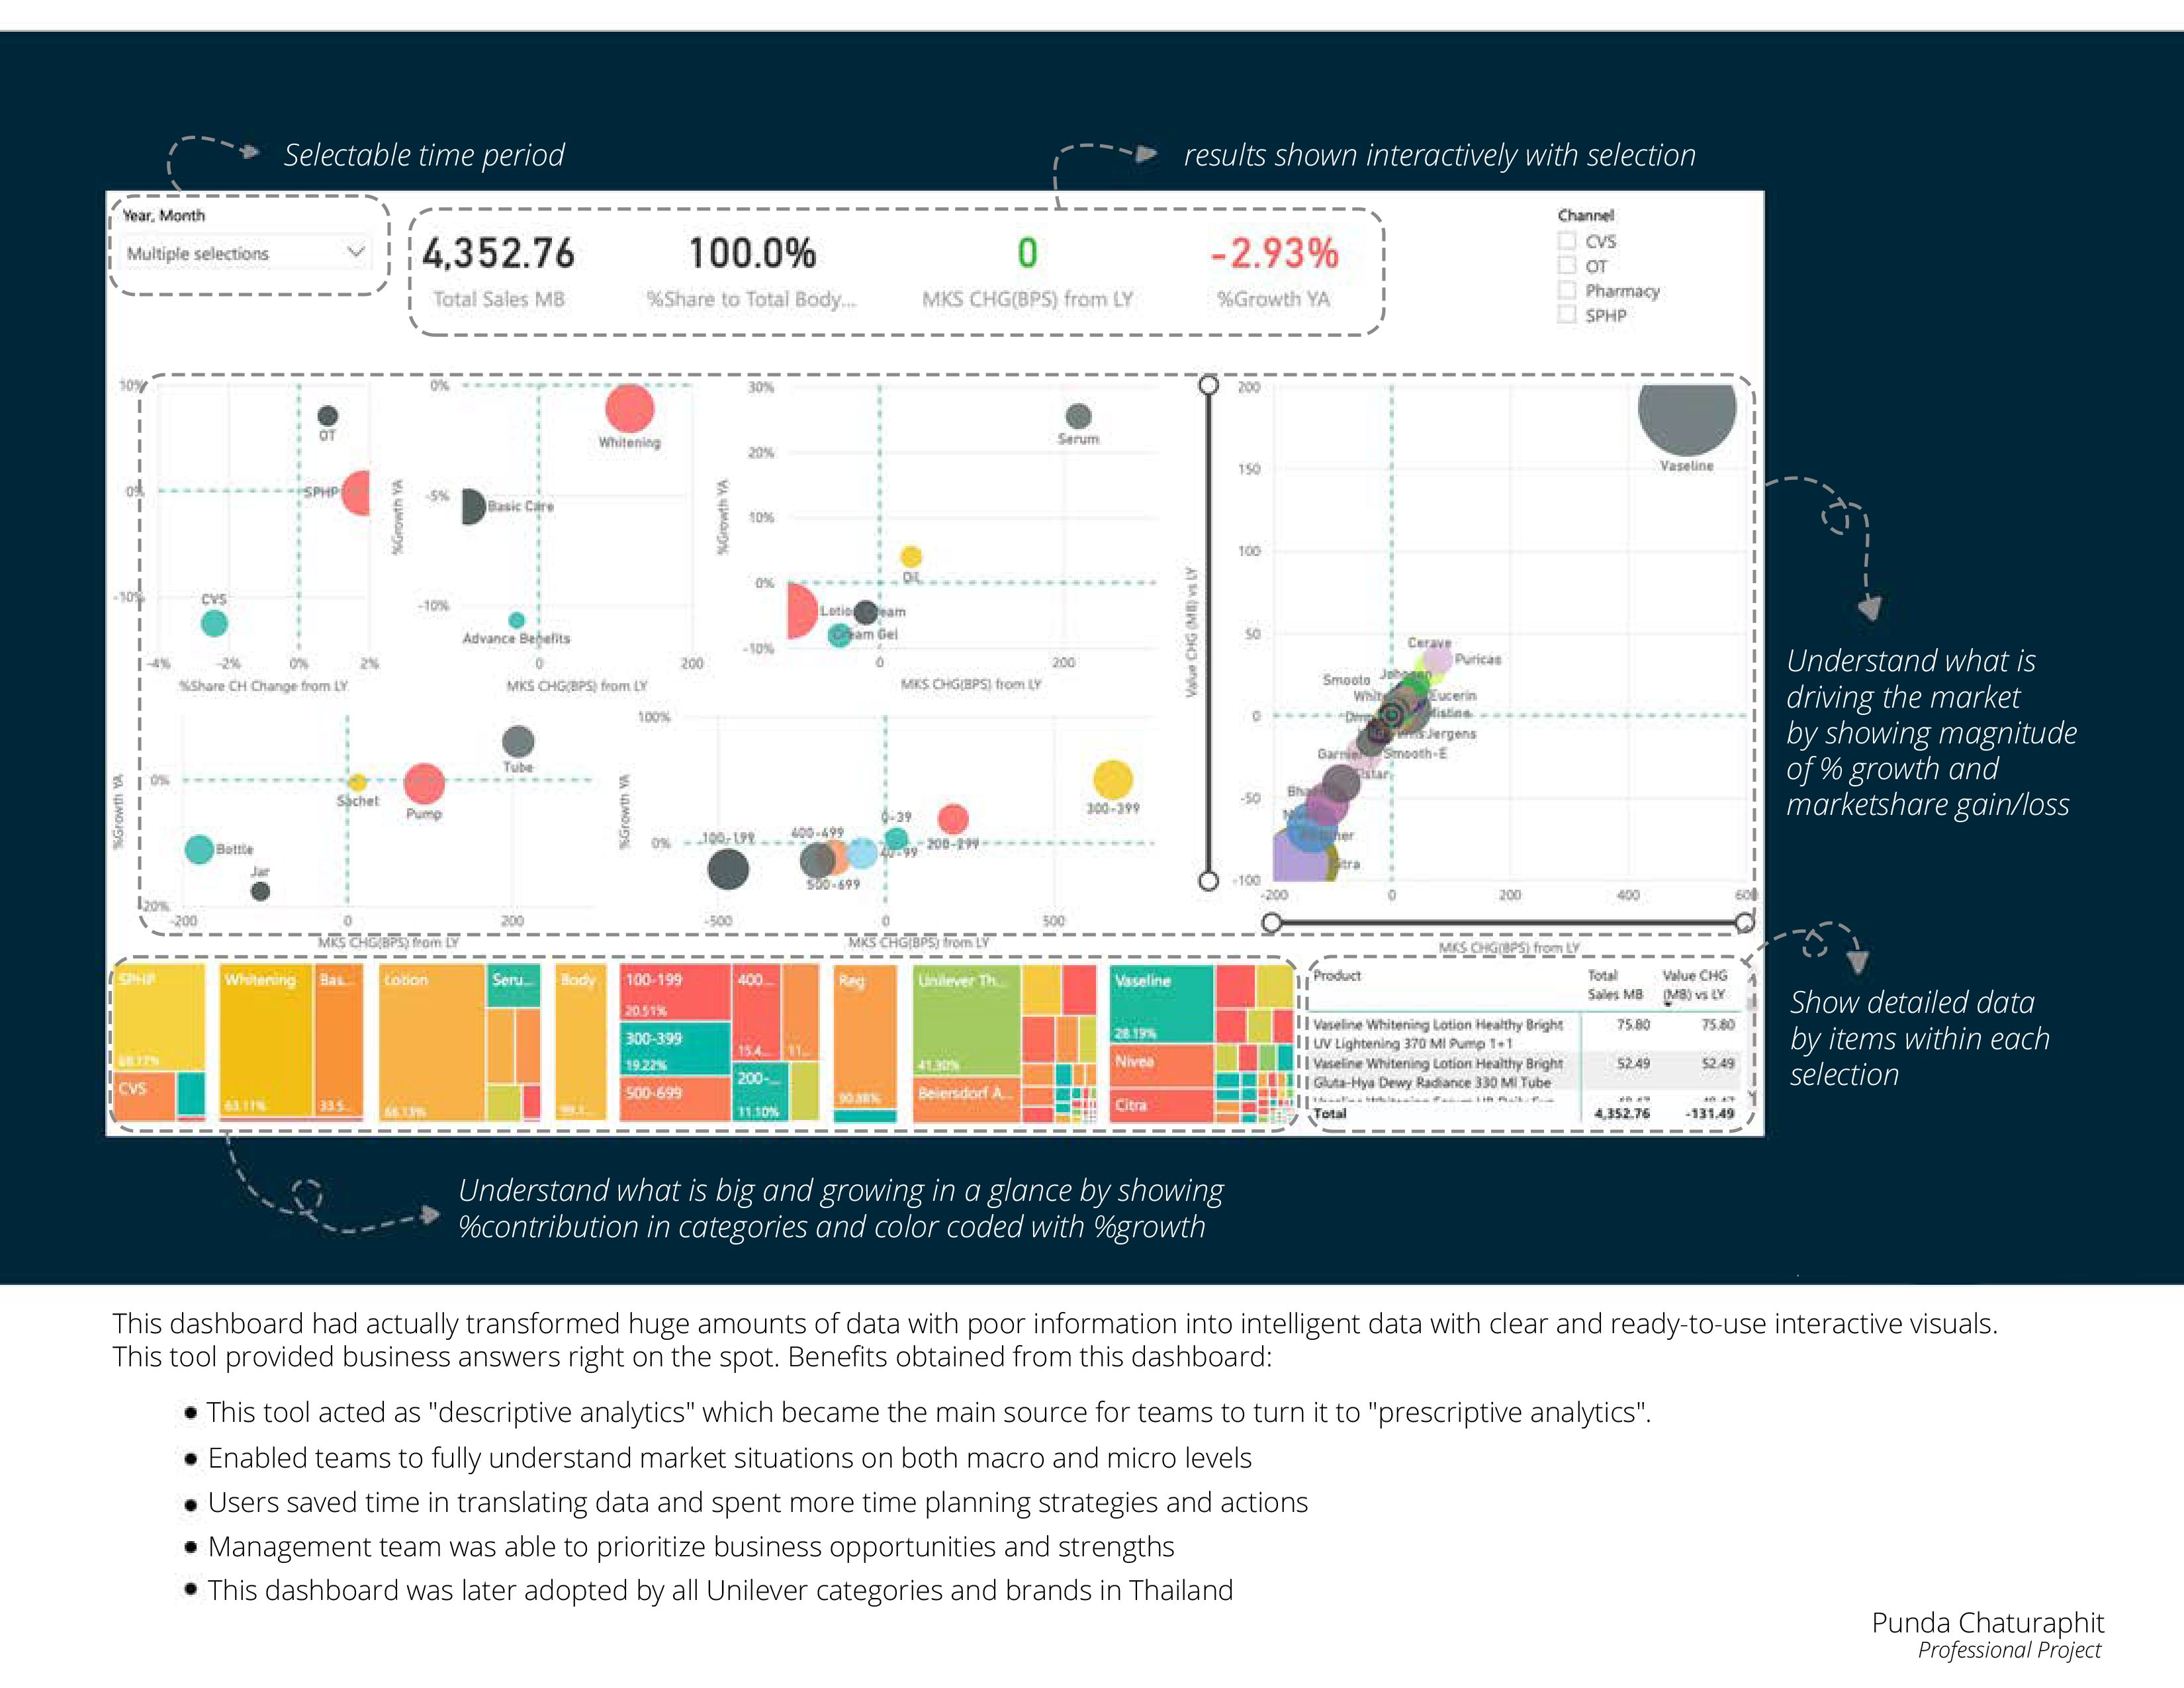
My objective was to come up with a tool that could deliver business insights instantly. I then designed a dashboard that calculated all the data and turned them into easy-to-interpret visuals. The dashboard must have capability to display market situations from all angles and must be able to answer all business questions promptly on one page.
Sketches and Design
This dashboard had actually transformed huge amounts of data with poor information into intelligent data with clear and ready-to-use interactive visuals. This tool provided business answers right on the spot.
Product

Benefits obtained from this dashboard:
This tool acted as "descriptive analytics" which became the main source for teams to turn it to "prescriptive analytics".
Enabled teams to fully understand market situations on both macro and micro levels
Users saved time in translating data and spent more time planning strategies and actions
Management team was able to prioritize business opportunities and strengths
This dashboard was later adopted by all Unilever categories and brands in Thailand